
In my previous post I wrote about upgrading your existing vROps environment (6.0) to 6.4 Considering the case when it has been upgraded to latest version i.e. vROps 6.4 what new features or functionalities it brings to the table. From features standpoint there are whole bunch of new features but in this post I’ll be concentrating more on its dashboard part. The biggest & most useful piece of function from vROps has always been its dashboard (since vCOps days). It not only gives admins an overall picture of the environment but also helps to pinpoint the affected object based upon which remediation can be applied. Most of the administrator will agree on this statement if you can identify which object is behaving abnormal, half of the troubleshooting is over there itself. So without delay let’s dig into vROps 6.4 dashboard and some of its Out-of-Box features.
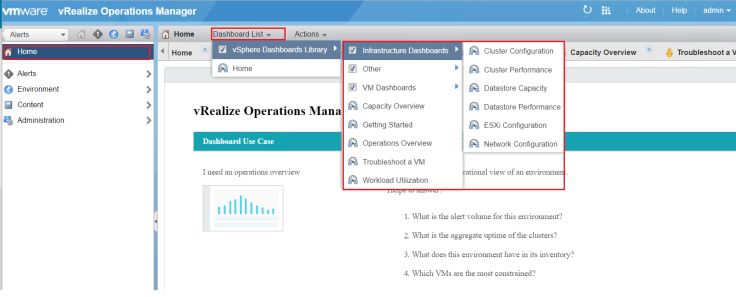
The first thing we notice after successfully logging into vROps homepage is Getting Started page, this page tells about the overall capabilities of the product and what we can expect from it. It also gives a glimpse of various dashboards available in vROps which can be a great help for someone who is learning this product. Above to that is the Dashboard List drop down where the real magic starts. Admins can select their choice of dashboard from here, however for most of the day-two operations Infrastructure Dashboards or VM dashboard will suffice the need. But it all depends upon the administrator how they want to look at their infrastructure.
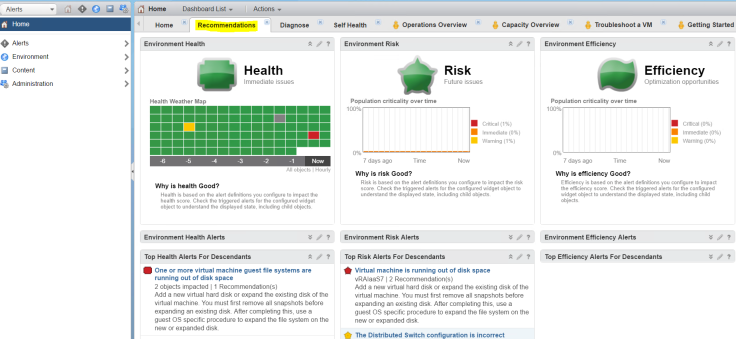
Once we select the dashboard of our choice the first dashboard I would like to discuss about is Recommendations– someone who has any prior experience with older versions of vROps (or vCOps) will find it very similar with same kind of information displayed in the form of Health, Risk & Efficiency. Unlike older versions of vROps the metric value (0-100) has been removed from the main dashboard but if you dig down to individual badge one can find out the badge value. Also at the bottom you can find Top Health/Risk/Efficiency descendants- in below screenshot we can see that one of the virtual machine is running out of disk space. This gives overall status of environment and can take necessary actions well in advance to mitigate risks.
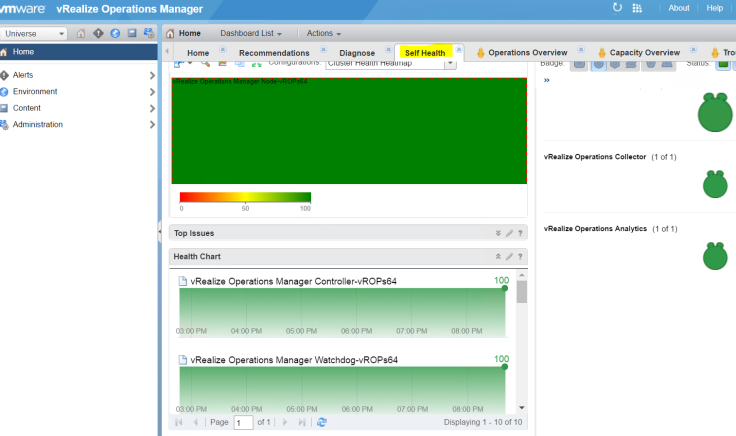
Having a forensic or monitoring entity in your environment is one thing but how it monitors itself takes it to next level. vROps 6.4 has the ability to self monitor its health and generate alert if any of its object or adapter stops working. There is a dedicated tab Self Health in the dashboard which shows vROps health. Admin has to select the vROps node which they want to monitor and it gives whole bunch of services and processes status which are running as part of that node. Many a times I have seen customers talking about vROps giving stale information of their environment. It may happen if due to some reasons any of vROps stops receiving data from its adapter or any of its service isn’t working properly . So this is a good way to check if you come across with such situation and cater such problem.
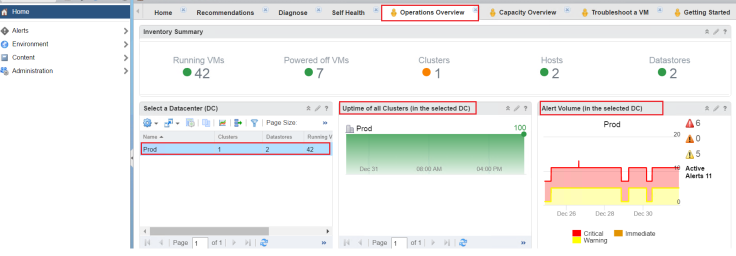
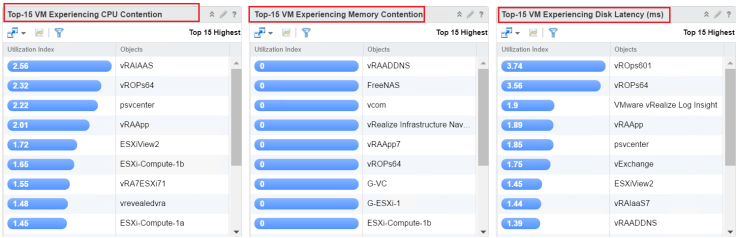
Next dashboard which I want to discuss about is Operational Overview. This dashboard is like a One-Stop place which shows most of the information which any administrator will need for daily monitoring. It tells about number of Cluster, Power ON/Off virtual machines, hosts, datastore and alerts created in that cluster. This information is way more granular than what we can get from vCenter console. In my case I have single cluster environment but in real world where administrators have to deal with huge infrastructure with multiple clusters this dashboard gives them a single pane of glass view. Another interesting information this dashboard gives is Top Contention view of virtual machine from CPU, Memory or Disk perspective. From my personal experience when application admins raise their concern over a particular virtual machine’s performance it used to take hours if not day(s) to solve performance issues. With this view in hand it makes the overall investigations quite simple and factual.
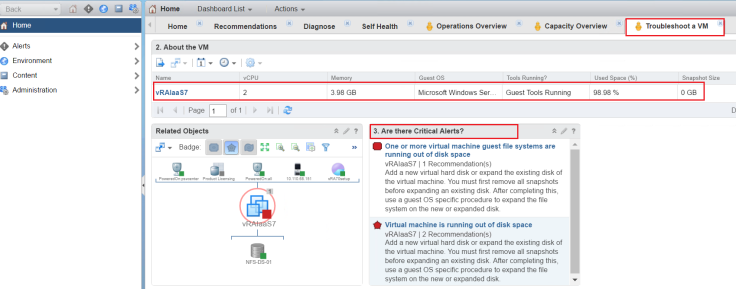
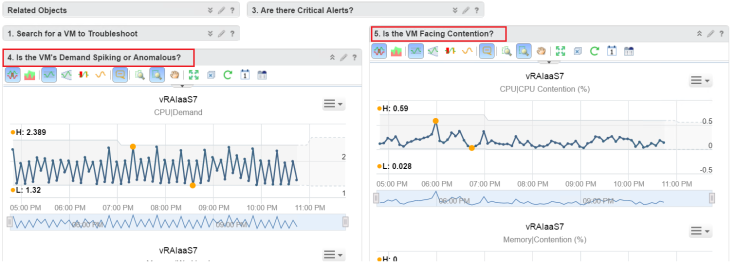
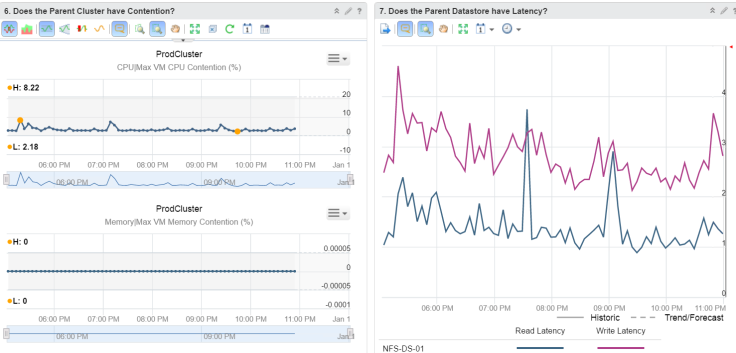
Next dashboard which comes in handy with vROps 6.4 is Troubleshoot a VM. This view is very useful in case where an administrator wants a deep-dive information related to a vm. The first tab of this dashboard About gives an overall glimpse of the virtual machine about its CPU/Memory/Disk usage, OS version, VMWare Tool status & Snapshot size. If there are any alerts associated to that virtual machine they are also listed just down below so that you get a holistic view. In my case vRAIaaS7 virtual machine is running out of disk space and it is displayed as Critical alert. It also displays recommendations to re-mediate this alert. Further number 4 & 5 tabs can show you the demand & contention view of selected virtual machine. These views can also show demand vs usage graphs which helps in trend analysis of that vm. Similar way tab 6 & 7 contention on the Parent Cluster or Datastore on which the vm is residing. One Cluster side it shows CPU/Memory contention percentage and from datastore side it gives Read/Write Latency information.
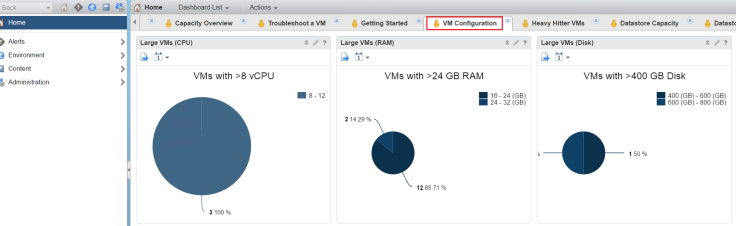
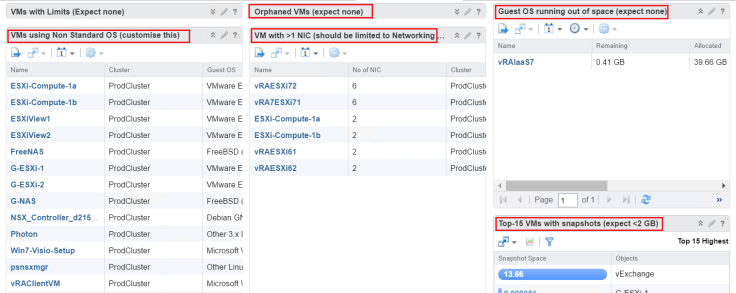
Next cool dashboard which I would like to discuss about is VM Configuration – many a times we want a quick summary like how many virtual machine in our environment are running with large vCPU or with huge disk. This dashboard gives the information instantly. Apart from that it also shows information if there are any Orphan VM in the environment or how many virtual machines are running with >1 vnic. If there are vms with Non-Standard OS those are also listed inside this dashboard view. But one this which is very important for any administrator is to keep track of vm Snapshots and this view (bottom right) can give that information as well. I have seen many customer creating custom scripts to cater to this problem which can easily be handled in vROps 6.4 version.
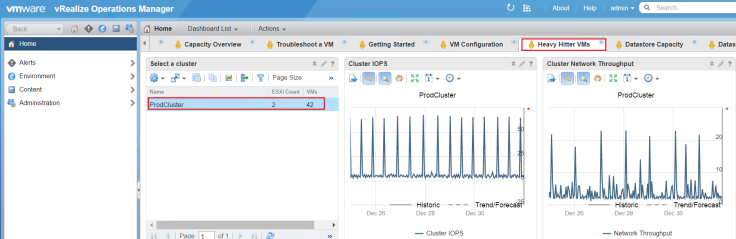
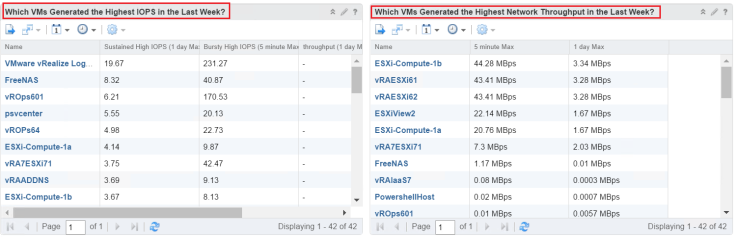
Heavy Hitter VMs – this particular dashboard is very useful in environment for virtual machines generating heavy I/Os. Simply select the Cluster (on left side) and you get a glimpse of cluster IOPS & network throuoghput. Just below that it populates list of virtual machines generating heavy IOPS. By default it shows data from last 7 days but it can be customized to desired duration.
There are plenty of dashboards available in vROps 6.4 and in my above post I have discussed about few of them which I consider as Out-of-Box. With this I end this blog, till then Happy Reading..and “Happy New Year”

")


Great summary – I just upgraded to 6.4 – it was helpful to understand the out-of-the-box dashboards.
LikeLike
Thank Simon, I’m happy that my article helped 🙂
LikeLike